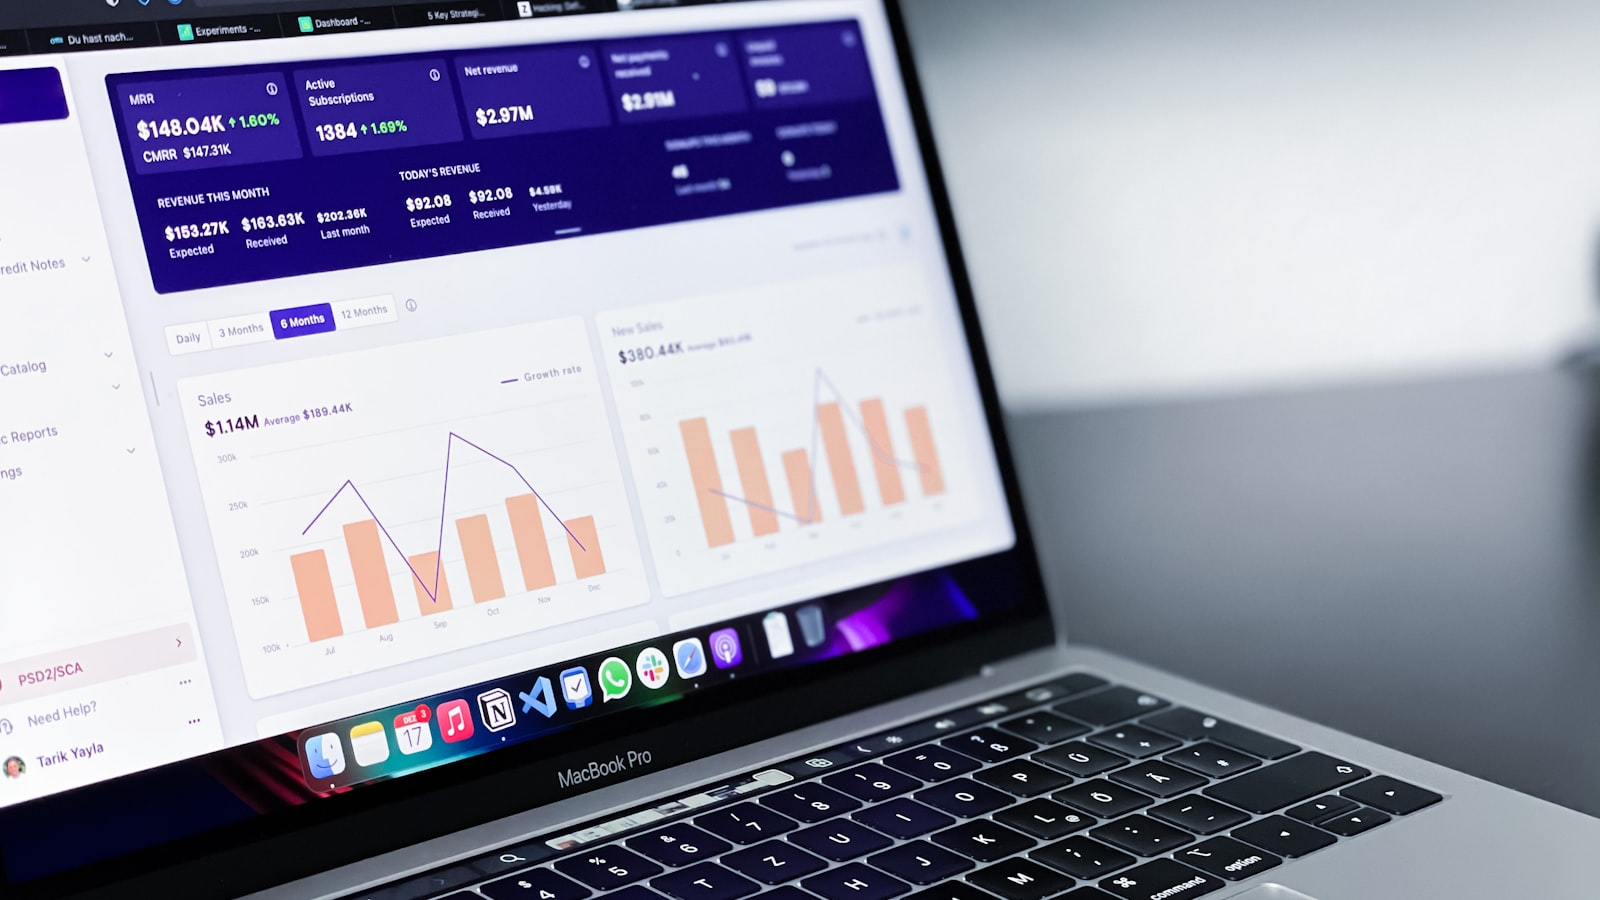
The Monthly KPI Dashboard Every Owner Should See
Written on . Updated on .

The short answer: A monthly KPI dashboard is a one-page view of the seven financial numbers that predict whether your business stays solvent, and it matters because only about 34.7% of businesses that opened in 2013 were still operating a decade later.
- Track seven core KPIs every month: cash position and runway, gross margin, AR/AP aging with days sales outstanding, revenue vs. plan, labor as a percent of revenue, current ratio, and net profit margin.
- Cash problems are the most common pain owners report: 51% of small employer firms cited uneven cash flow and 56% cited paying operating expenses as a challenge (2024 Small Business Credit Survey).
- The dashboard is only as reliable as the monthly close behind it, which is exactly where client accounting and advisory services fit.
A monthly KPI dashboard is the short list of financial numbers a small-business owner should review at the close of every month to see, at a glance, whether the business is healthy. Most owners already have this data sitting in their accounting system. The problem is not access, it is visibility: the numbers are scattered across reports instead of standing together on one page where a trend jumps out.
Survival is not guaranteed. U.S. Bureau of Labor Statistics data shows about 20% of new establishments do not survive their first year, and roughly half do not survive five years. Owners who watch a handful of health metrics every month can act while the numbers are still fixable, instead of discovering a problem in next year’s tax return.
What Is a Monthly KPI Dashboard, and Why Does Every Owner Need One?
A monthly KPI dashboard is a single, repeatable view of your most important financial indicators, refreshed after each month-end close. A KPI (key performance indicator) is a metric tied to a decision; a plain metric just describes activity. The difference matters: revenue is a metric, but revenue against your plan is a KPI, because it tells you whether to act.
The U.S. Small Business Administration endorses building this view from data you already have. Owners can learn to find the most relevant indicators, interpret trends, and make informed choices, per an SBA training program on small-business performance.
“Good records will help business owners… Monitor the progress of their business.” — Internal Revenue Service, Tax Tip 2019-157
What this means for you: the dashboard is not extra work layered on top of accounting. It is the payoff for keeping accurate books, which the IRS already requires you to maintain to substantiate income and deductions.
What KPIs Should a Small Business Owner Track Monthly?
A small business owner should track seven core financial KPIs monthly: cash position and runway, gross margin, receivables and payables aging with days sales outstanding, revenue vs. plan, labor as a percent of revenue, current ratio, and net profit margin. Together these cover liquidity, profitability, and collections, which are the three areas where most failures begin. The ranges below are general guidelines only and vary widely by industry.
| Metric | What It Tells You | How to Read It (General Guideline) |
|---|---|---|
| Cash position & runway | How many months of operating expenses your cash on hand can cover | Many owners aim for 3 to 6 months of runway; the right target depends on how lumpy your revenue is |
| Gross margin | Revenue left after the direct cost of what you sell, as a percent | Varies widely by industry; watch the month-over-month trend more than any single number |
| AR/AP aging & DSO | How fast customers pay you (and how fast you owe suppliers) | Many businesses target days sales outstanding under 45 days; compare it to your stated payment terms |
| Revenue vs. plan | Actual revenue measured against the budget you set | Within roughly 5% to 10% of plan is a common comfort band; a widening gap is the signal, not the point estimate |
| Labor as % of revenue | What share of every sales dollar goes to wages and payroll | Highly industry-specific (service firms run higher); track the trend against your own history |
| Current ratio | Whether current assets can cover current liabilities | A common rule of thumb is 1.5 to 3.0; below 1.0 signals a liquidity squeeze |
| Net profit margin | What is left after all costs and taxes, as a percent of revenue | Varies widely by industry; the useful read is the direction over several months |
What this means for you: five to seven KPIs is enough. A dashboard crammed with twenty numbers hides the signal. Pick the vital few, put them in a fixed order, and read them the same way every month.
Which Financial KPI Is Most Important, and Why Does Cash Beat Revenue?
Operating cash flow is the single most important KPI for most small businesses, because a profitable company can still fail if it runs out of cash before customers pay. Revenue and even net profit are accounting outcomes; cash is what actually pays payroll, rent, and taxes on their due dates.
The Federal Reserve’s data bears this out. In its 2024 Small Business Credit Survey, 51% of firms cited uneven cash flow and 56% cited paying operating expenses as a challenge, and more than 9 in 10 firms experienced a financial or operational challenge that year, with 75% pointing to rising costs. A cash-and-runway KPI is the earliest warning system for exactly these pressures.
Cash discipline also carries hard tax deadlines. Self-employed owners owe self-employment tax of 15.3% (12.4% Social Security up to the $184,500 wage base for 2026, plus 2.9% Medicare) on their net earnings, and estimated tax is due in four installments across the year. Miss the safe harbor and the IRS charges interest: 7% per year, compounded daily, for the quarter beginning July 1, 2026. Reserving cash monthly for these obligations keeps a predictable bill from becoming a liquidity event.
How Does a Disciplined Monthly Close Deliver These Numbers?
A disciplined monthly close is the process that turns raw transactions into a trustworthy dashboard. Without a repeatable close, the numbers are stale or wrong, and a dashboard built on bad inputs is worse than none. The IRS reminds owners that the burden of proof to substantiate every entry rests with the taxpayer, so the close is both a management tool and a compliance safeguard.
A practical monthly close runs in a fixed sequence:
- Reconcile every bank and credit-card account so cash on the dashboard is real, not an estimate.
- Review AR and AP aging and calculate days sales outstanding before the month rolls forward.
- Post payroll and confirm deposits, since monthly-schedule depositors must remit employment taxes by the 15th of the following month.
- Compare actual results to plan and write one or two sentences explaining any variance beyond 10%.
- Refresh the seven KPIs and review the trend, not just the current month.
What this means for you: a worked runway example makes it concrete. If you hold $60,000 in cash and spend $20,000 a month on operating expenses, your runway is three months. That single number changes how you approach hiring, a large purchase, or a slow-paying customer, and you only see it if the close happens on schedule.
How Does a KPI Dashboard Tie Into CAS and Advisory?
A monthly KPI dashboard is the natural output of client accounting services (CAS) and the starting point for advisory work. CAS delivers the disciplined close and clean books each month; advisory reads the resulting dashboard with you and turns it into decisions. One produces the numbers, the other interprets them.
This matters because owners are not short on data, they are short on time and interpretation. Small businesses are the backbone of the economy: 34,752,434 of them (as of 2024), 45.9% of private-sector employment, and 43.5% of U.S. GDP, per the SBA Office of Advocacy. Yet the same owners juggling all of that rarely have an hour each month to sit with the numbers. A dependable dashboard, reviewed with an advisor, closes that gap.
What this means for you: you do not have to build the dashboard, run the close, and interpret the trends alone. The right-sized answer is to let a disciplined close produce the numbers and to spend your time on the two or three decisions they point to.
Frequently Asked Questions
What KPIs should a small business owner track monthly?
Track seven core financial KPIs monthly: cash position and runway, gross margin, AR/AP aging with days sales outstanding, revenue vs. plan, labor as a percent of revenue, current ratio, and net profit margin. Together they cover liquidity, profitability, and collections, the three areas where most failures start.
How often should you review a KPI dashboard?
Review your KPI dashboard monthly, right after the month-end close, so the numbers are current and comparable period to period. A monthly cadence matches the natural rhythm of tax and payroll deadlines, such as the 15th-of-the-following-month deposit rule for monthly-schedule payroll depositors, and it is frequent enough to catch a problem while it is still small.
What is days sales outstanding (DSO), and why does it matter?
Days sales outstanding measures the average number of days it takes to collect payment after a sale. It matters because slow collections tie up cash you have already earned. Many businesses aim for DSO under 45 days as a general guideline, but the meaningful read is DSO against your own payment terms and its trend over several months.
Ready to turn your numbers into a dashboard you actually use? Contact WhippleWood to talk through a monthly close and KPI review that fits your business.
Related: fractional CFO support, outsourced bookkeeping, and a conversation with our team about a monthly close and KPI review.
About the Author

Randall Joens CPA
Randall serves as the Director in charge of the firm’s Client Advisory Service (CAS) practice. In this role, he works with organizations to bolster their accounting function, drive efficiencies, maintain compliance with regulatory bodies, enhance financial reporting, and empower management to make more informed and effective decision making.